Trimodal Nature of Tech Compensation in the US, UK and India
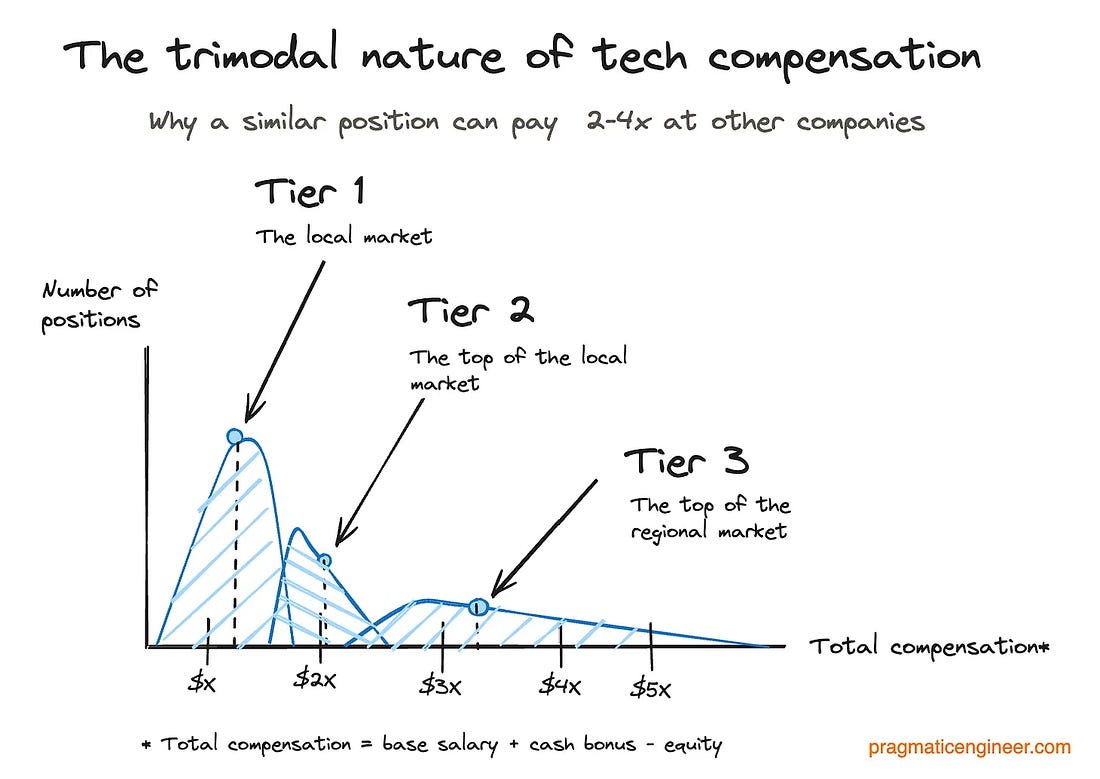
Trimodal Nature of Tech Compensation in the US, UK and IndiaDeepdive into the distribution of software engineering compensation, based on more than 20,000 data points from Levels.fyiHi – this is Gergely with the monthly, free issue of the Pragmatic Engineer Newsletter. In every issue, I cover challenges at Big Tech and startups through the lens of engineering managers and senior engineers. If you’ve been forwarded this email, you can subscribe here. The most-frequently cited article I’ve ever written is still The trimodal nature of software engineering salaries in the Netherlands and Europe – which is a deepdive published back in 2021. At the time, I had recently left my engineering manager job at Uber, and was trying to understand how tech compensation really works. At Uber in Amsterdam, I saw that comp for senior software engineering positions was 2-5x higher than for most “local” senior roles. To find out why this gap exists, I gathered hundreds of data points and talked with dozens of recruiters and managers; was this comp gap a symptom of “bimodal” distribution, as Daan Luu posited in 2016? After researching, I felt confident enough to say that tech compensation in the Netherlands and Europe was trimodal:
Last year, we returned to this topic in The Trimodal nature of tech compensation revisited, which validated the distribution by using more than 1,000 data points from the Dutch market, and quotes from engineering leaders and software engineers in the US, UK, Canada, and Japan, which suggested that a “trimodal” model is real. Even so, this was partly anecdotal and in need of hard data to confirm it. Today, we finally have the numbers, thanks to the Levels.fyi team,, and this article dives into the findings by region, covering:
The data on the US, UK, and India reveals a complex regional picture united by a trimodal model. See below:
If you want to look even deeper into this topic, check out other detailed articles on tech compensation:
Thank you to Hakeem Shibly, Zuhayeer Musa, Zaheer Mohiuddin and the Levels.fyi team for sharing massive amounts of data and insights for this deepdive. The bottom of this article could be cut off in some email clients. Read the full article uninterrupted, online. Data sourceThis article uses more than 10,000 compensation data points sourced from Levels.fyi, a compensation comparison site which is great for:
Levels.fyi is powered by a combination of self-reported and verified data points. They offer resume review and salary negotiation services with Big Tech recruiters. A neat feedback loop of this is that information from their salary negotiation services helps the team ensure that submitted data really is valid. Levels.fyi also has a job board and provides compensation benchmarking services for businesses. Some stats about Levels.fyi:
A team of 13 people is behind the site and app, and I recently grabbed coffee with several of them in San Francisco. This article covers “total compensation” (TC), not only salary. TC includes all forms of annual comp:
For example, a $300K TC package might look like this:
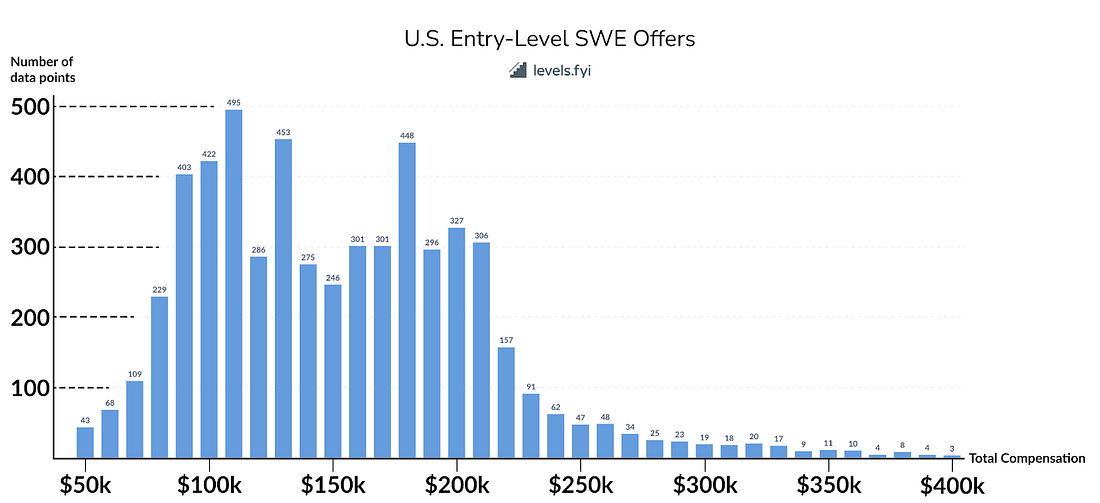
Equity is a tricky topic but also a key one, more on which is in the “Note on equity” section near the foot of this article. 1. US: entry-level software engineersLet’s start with entry-level software engineer offers submitted to Levels.fyi in the past year for the world’s biggest tech market. Here’s how these data points were filtered:
We have 5,601 entry-level US data points after applying the filters. A visualization:
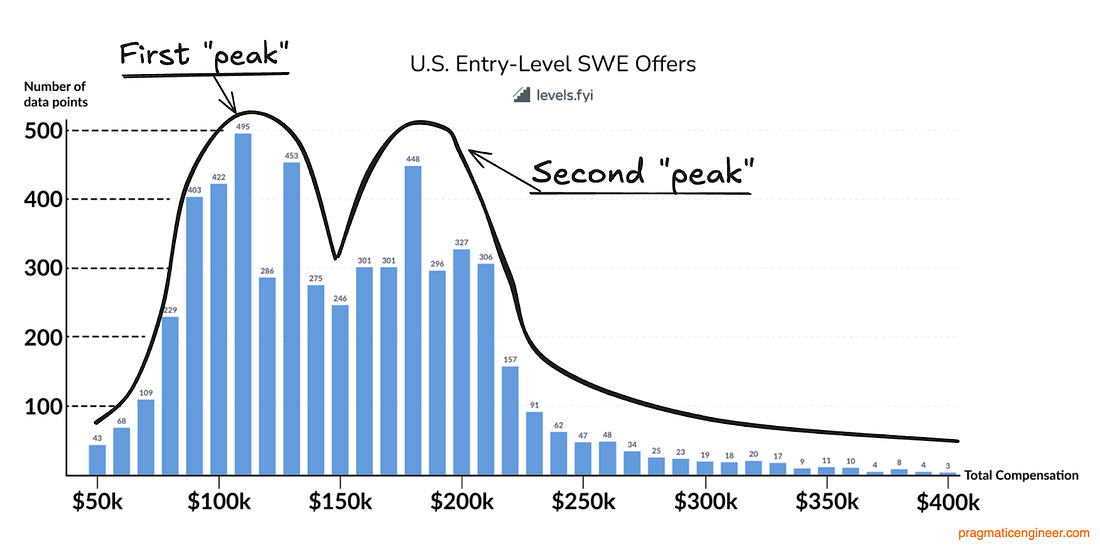
At first sight, this distribution fits what looks more like a bimodal distribution, with a first peak at $100-110k, and a second peak at $170-180k:
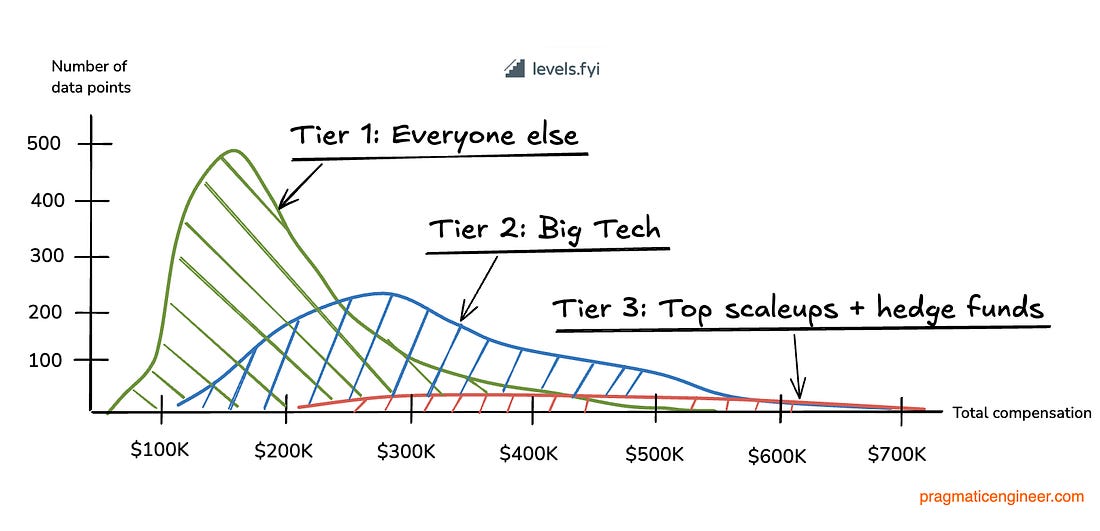
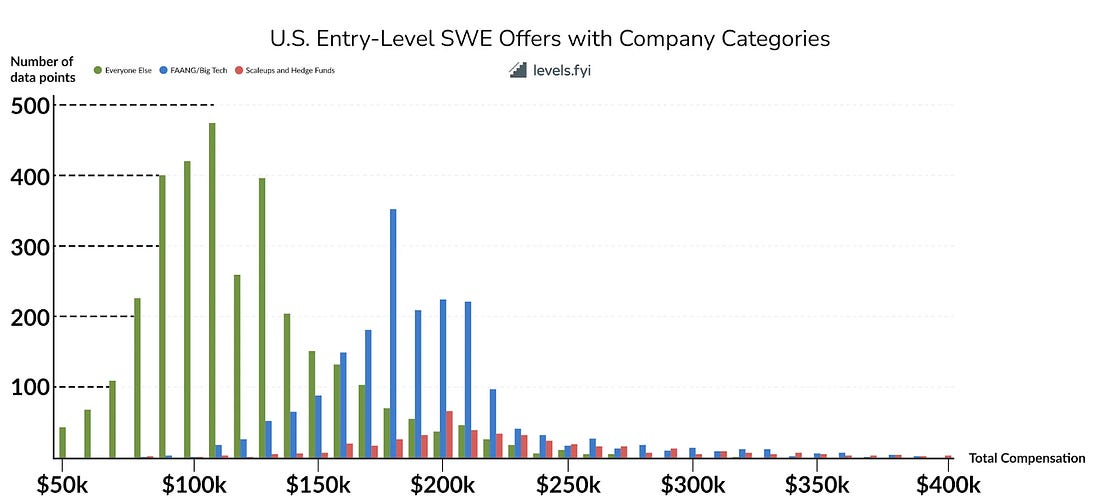
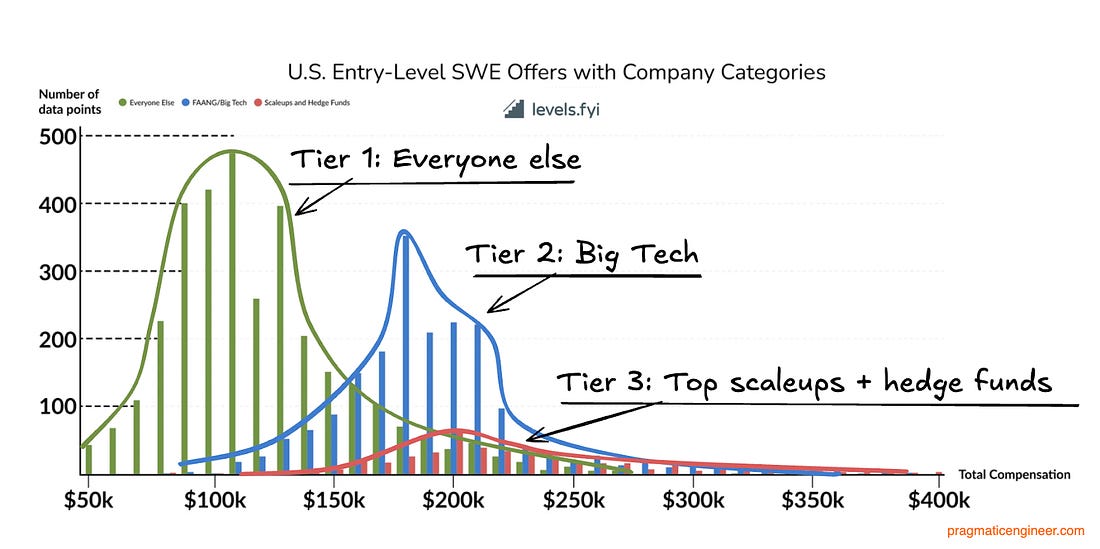
However, after sifting through the data and manually tagging companies by common traits, we find the data organizes itself differently. The chart below takes the same data and organizes it based on the assumption behind the original trimodal distribution: that companies compensate based on the market they compete in. We use three categories of business type:
Here’s how the same data looks when broken down into these categories:
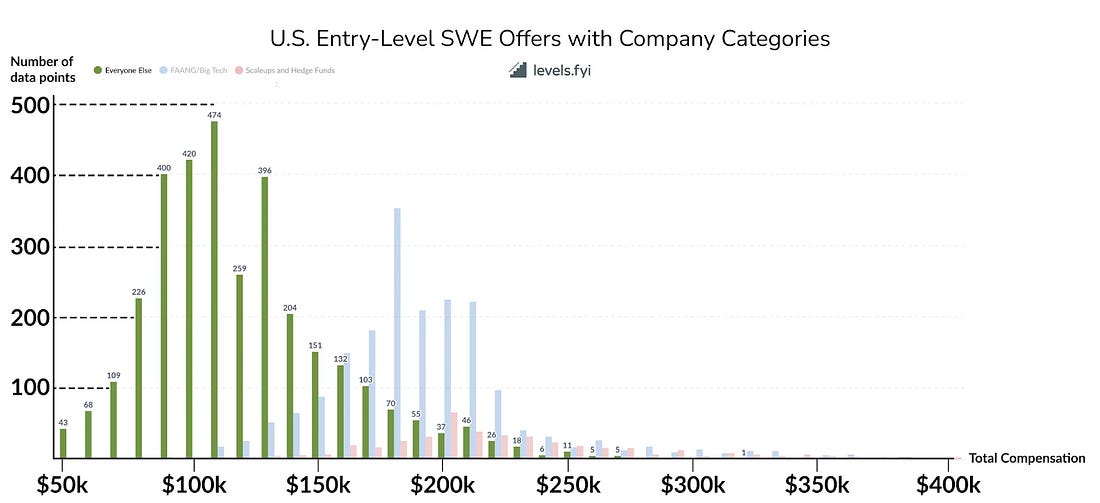
Now, let’s check each segment. Tier 1: Everyone elseThis category consists mainly of companies competing for local talent, which often are not driven by their engineering talent or digital products.
This resembles the lowest tier (“Tier 1”) of the trimodal model. It’s interesting how drastically the distribution changes by removing Big Tech, top scaleup, and hedge fund data points! Tier 2: Big Tech
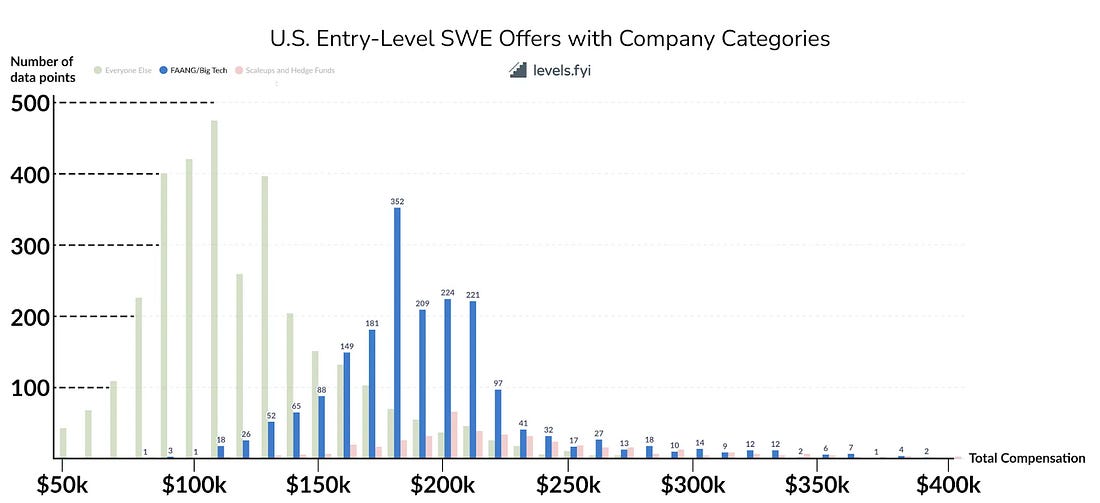
The largest publicly traded tech companies compensate engineers with increasingly large equity packages up the career ladder. I split this category for two reasons:
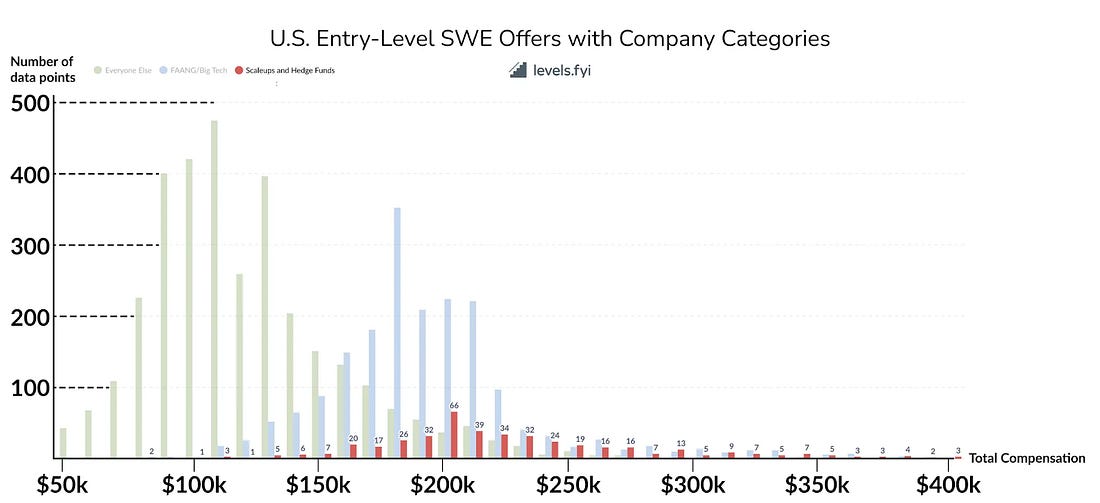
Tier 3: Top scaleups and hedge funds
This is a very interesting category with a lack of high-quality data, outside of Levels.fyi, for two reasons: Private scaleups issue not-yet-liquid equity. Many assume Big Tech companies offer the most, compensation-wise. And this is true in terms of liquid equity; shares that can be sold for cash is an area where Big Tech is near-impossible for scaleups to match. However, top-tier startups and scaleups can – and do – offer more total compensation than Big Tech. But there’s a catch: their equity cannot be sold until a liquidity event happens like an IPO, or stock buyback. Scaleups which out-offer Big Tech in total comp include Databricks and OpenAI. It makes sense for late-stage scaleups to make bigger total comp offers than Big Tech because they target the same talent and must compensate for the fact their equity grants are illiquid, and may not become convertible to cash any time soon. Plus, there’s also the risk of a grant losing value like at Foursquare, where employees’ stock options ended up as worthless. Hedge funds are notoriously secretive. Places like Two Sigma want to keep their compensation details as confidential as possible. Levels.fyi has accurate data points, but not enough to make this group into its own category. So, they’re included with scaleups here. The compensation philosophy of hedge funds is very different than at Big Tech and scaleups:
Overlapping categoriesLet’s look at all three categories of employer in a single graph:
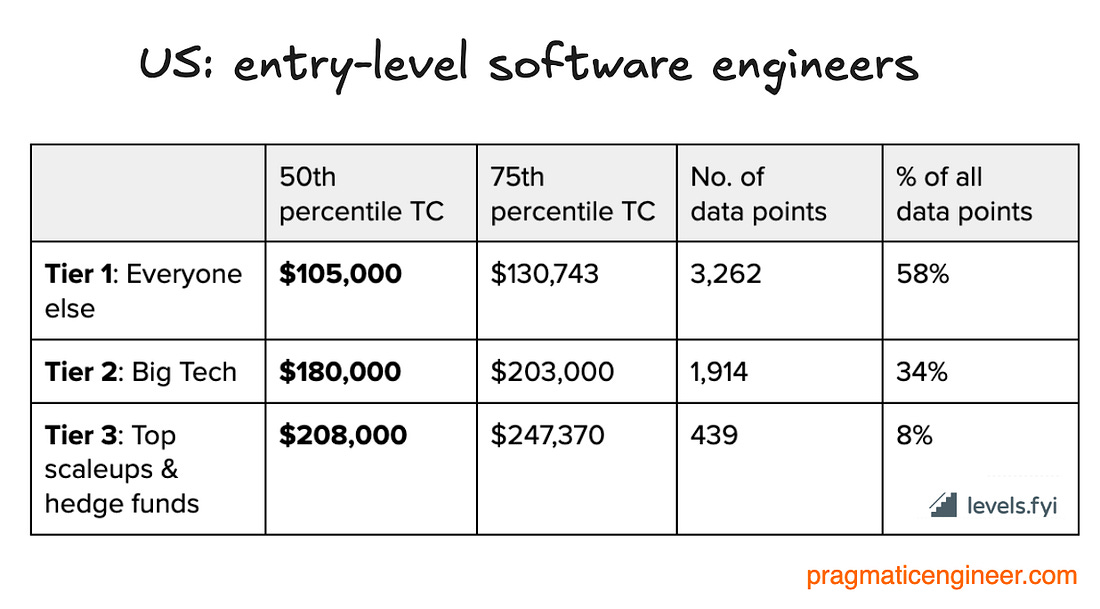
And also let’s check out the median and 75th percentile total compensation packages of each category:
There are a few interesting points about this distribution:
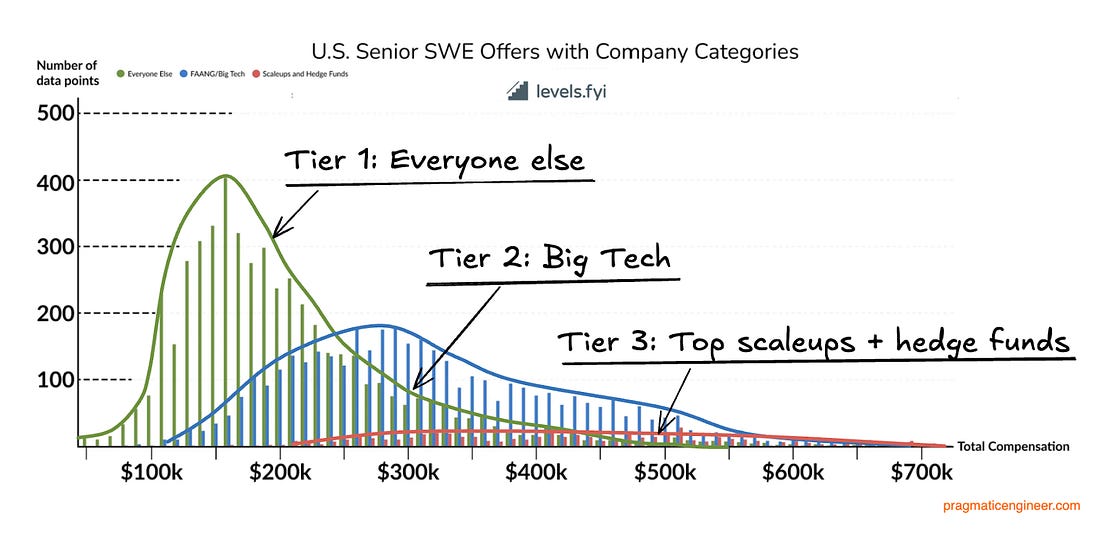
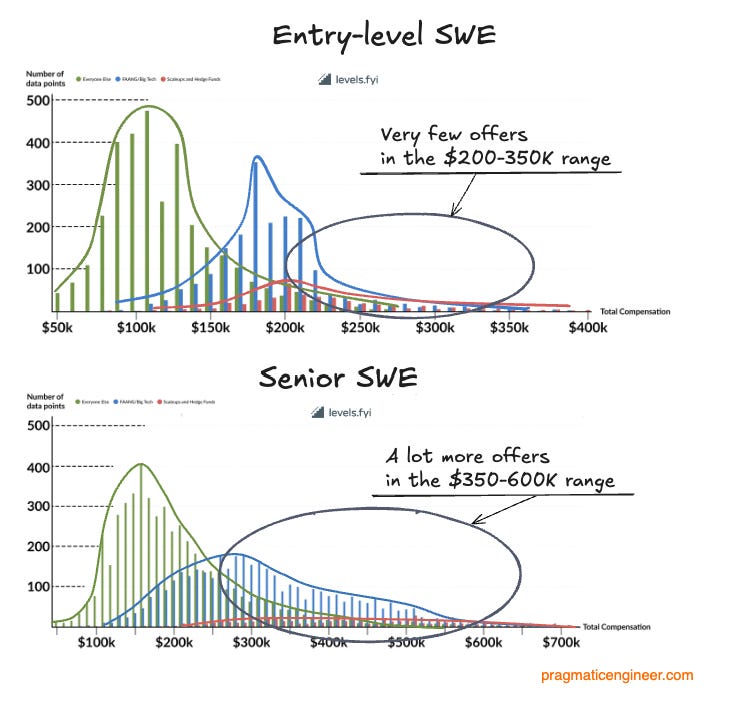
2. US: senior software engineersCompensation differences tend to grow with seniority, so let’s look at senior-and-above software engineers by adjusting the filters:
Let’s see how the same three categories map when looking at senior software engineers, split across the same tiers:
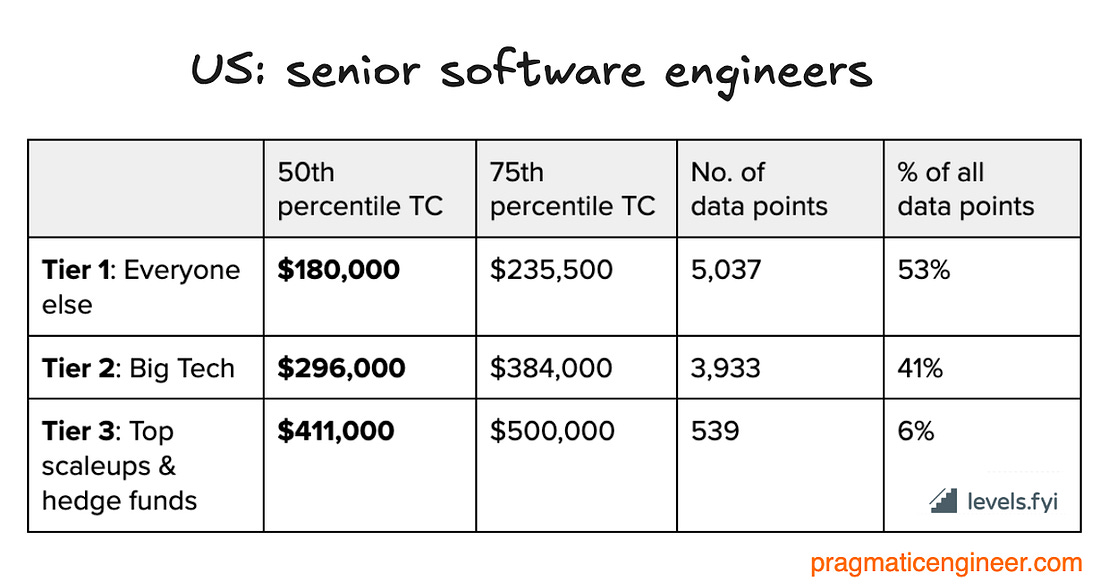
Here’s what these tiers look like in the median and 75th percentile compensation bands:
The tiers are more distinct for seniors than for entry-level engineers. Some observations:
Big Tech and scaleups+hedge funds have many outliers. The median entry-level Tier 1 compensation package was $105K – and there were few offers in tiers 2 and 3 that offered twice as much ($200K and above.) The median senior Tier 1 compensation was $180K, but now there are far more offers in tiers 1 and 2 worth double that ($350K and above). Visualized:
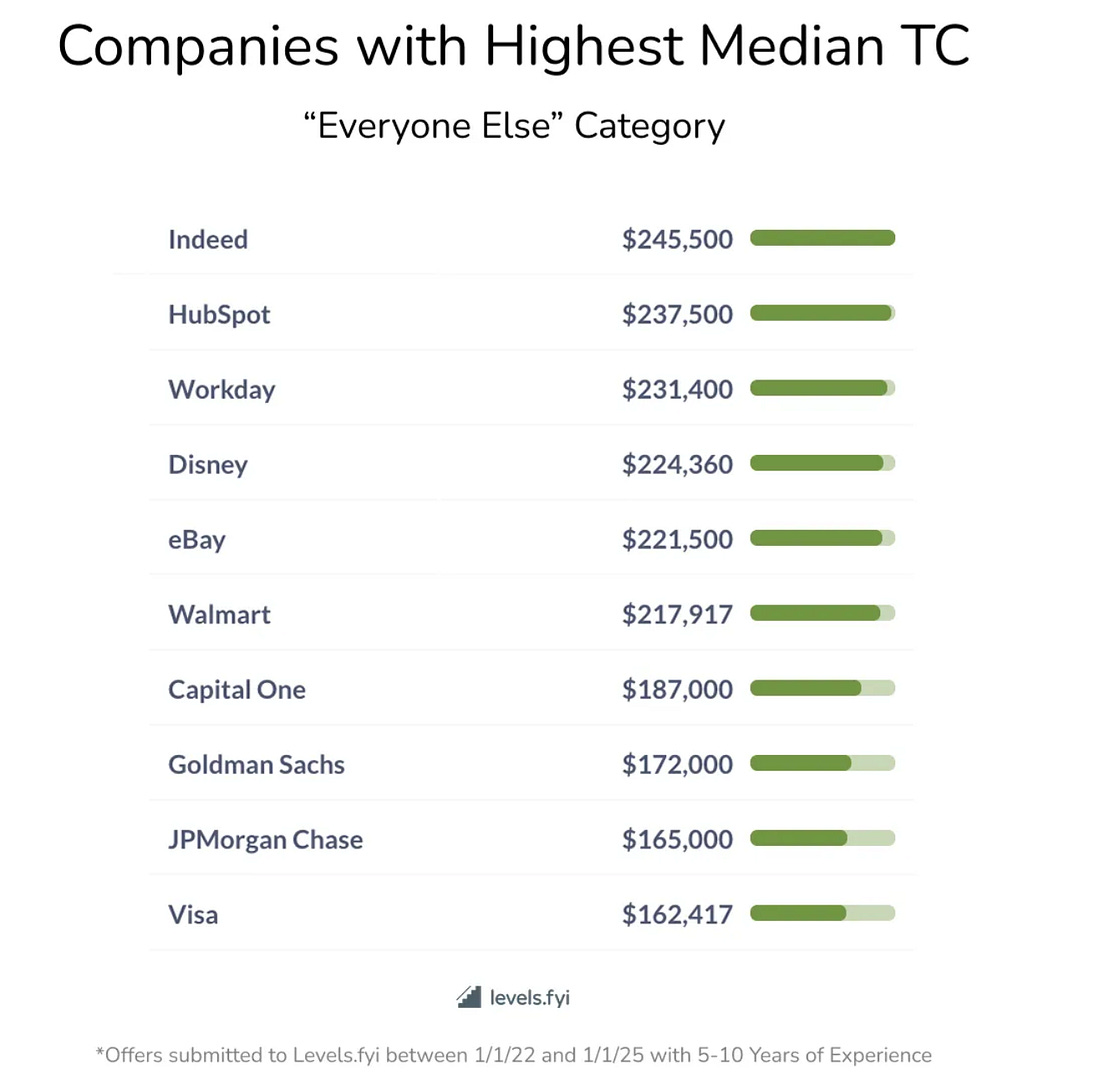
3. US companies paying highest by tierWith the data below, we look at the number of senior software engineer submissions and filter them for offers submitted by engineers with 5-10 years of experience. Tier 1: “everyone else”The highest median total compensation offers in this category were made by the companies listed below:
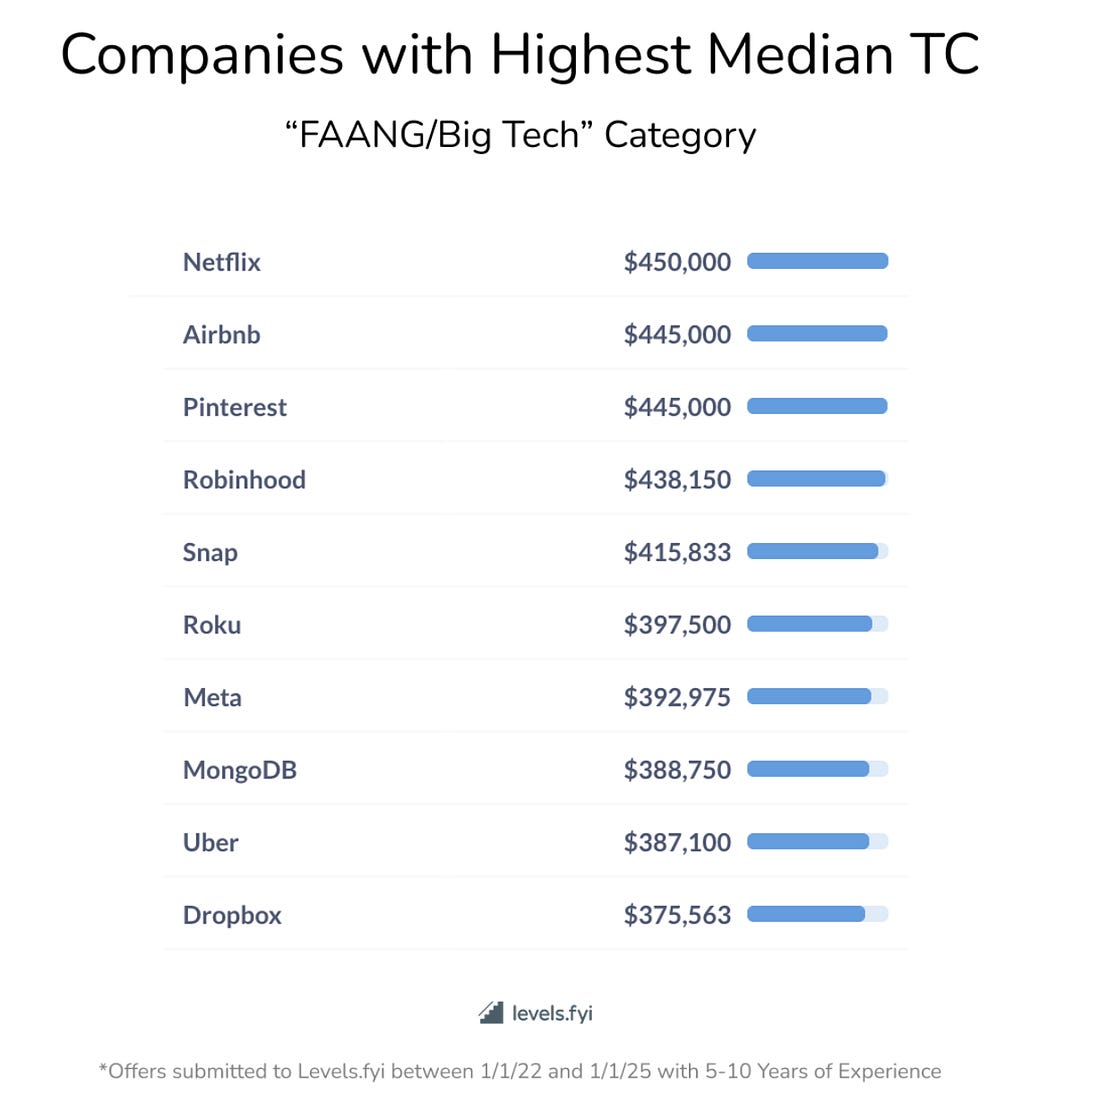
Leading employers in this category are Indeed, HubSpot, Workday, Disney, eBay, Capital One, Goldman Sachs, JPMorgan Chase and Visa. Which businesses in each tier are most worth targeting for jobseekers? One indicator is the number of submissions, which identifies companies that are hiring more than others. Of course, this also biases to companies which users have shared data about. In this category, it’s Capital One, Walmart, JPMorgan Chase, Disney, HubSpot, Indeed, Workday, Palo Alto Networks, Fidelity, and Visa. Tier 2: Big TechHighest-paying companies by median total compensation:
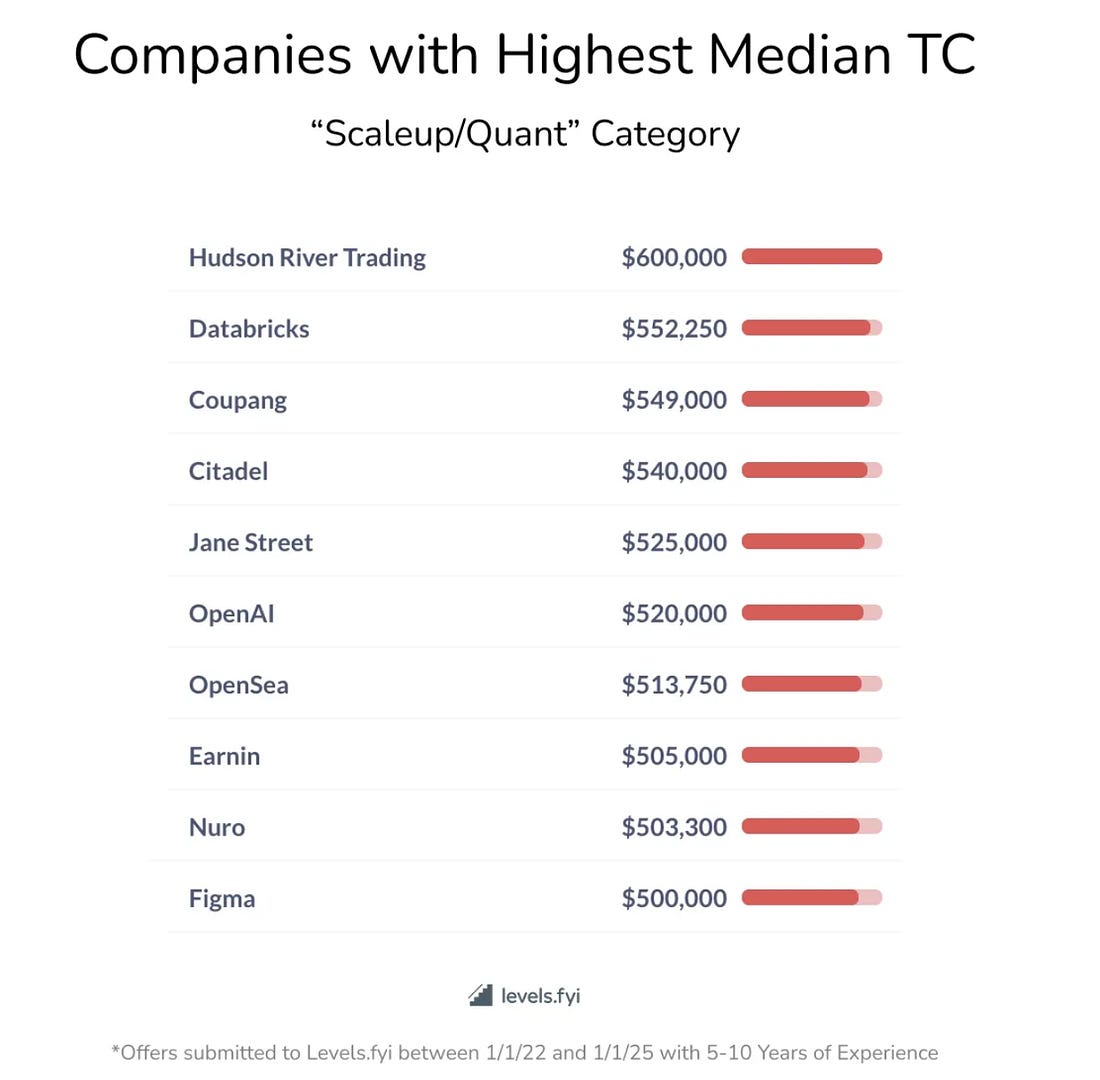
This is quite a jump: the median is nearly twice as high as in the “everyone else” category! You can find more details about individual packages and get a sense of the spread of offers per company, at the pages for Netflix, Airbnb, Pinterest, Robinhood, Snap, Roku, Meta, MongoDB, Uber and Dropbox. Most data points submitted: for this category, most data points submitted were for Amazon, Meta, Google, Microsoft, Apple, Oracle, Uber, Block, NVIDIA, and Salesforce. Tier 3: Top scaleups and hedge fundsThe cream of the comp crop; with hedge funds, quant firms, and top-tier VC-backed startups doing well. Companies with the highest median offers are:
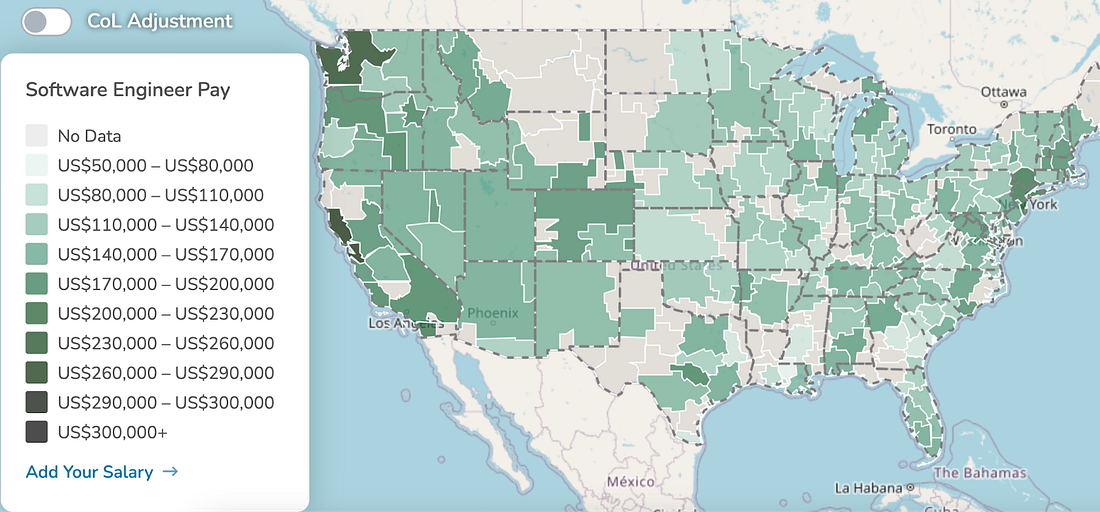
If you thought Big Tech has high median offers, these numbers are between 20 and 40% bigger. Hudson River Trading, Citadel, and Jane Street, are all hedge funds or quant firms, meaning their stated compensation is all cash. Others on the list are companies which IPOed in recent years like Coupang, or late-stage scaleups. Find more details about individual packages and get a sense of the spread of offers within a company by checking the respective pages on Levels.fyi of Hudson River Trading, Databricks, Coupang, Citadel, OpenAI, OpenSea, Earnin, Nuro and Figma. Most data points submitted: in this category, it’s Bytedance, Stripe, Cruise, Snowflake, Roblox, Coinbase, Databricks, Reddit, Rivian, and Anduril. The importance of locationLocation also impacts compensation packages. In the Bay Area, Seattle and New York, compensation packages are higher than in other areas in the US. We can get a better sense of how location plays a part using a heatmap – also built by Levels.fyi:
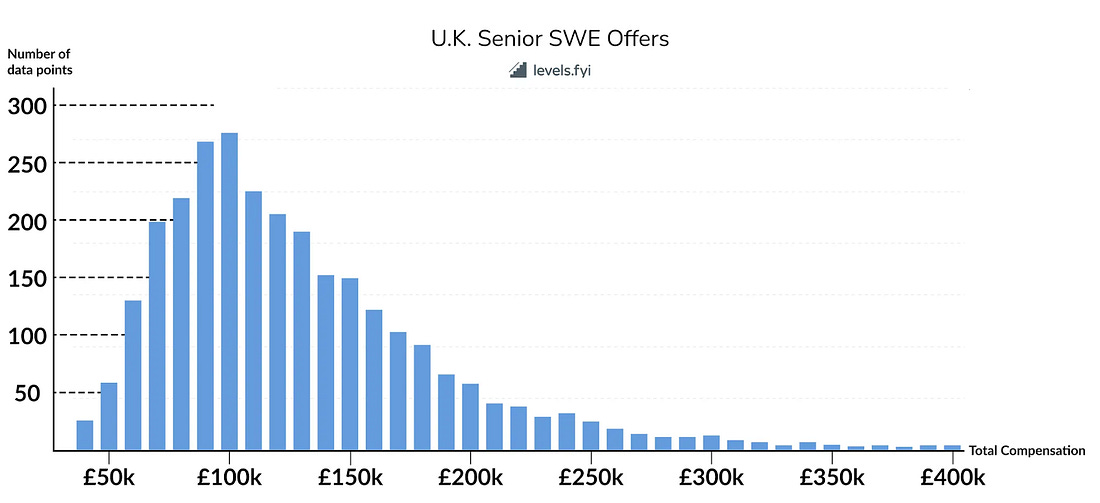
4. UK numbers and tiersHere’s the distribution of compensation data points for senior software engineers in the UK, mapped in British pound sterling (GBP):
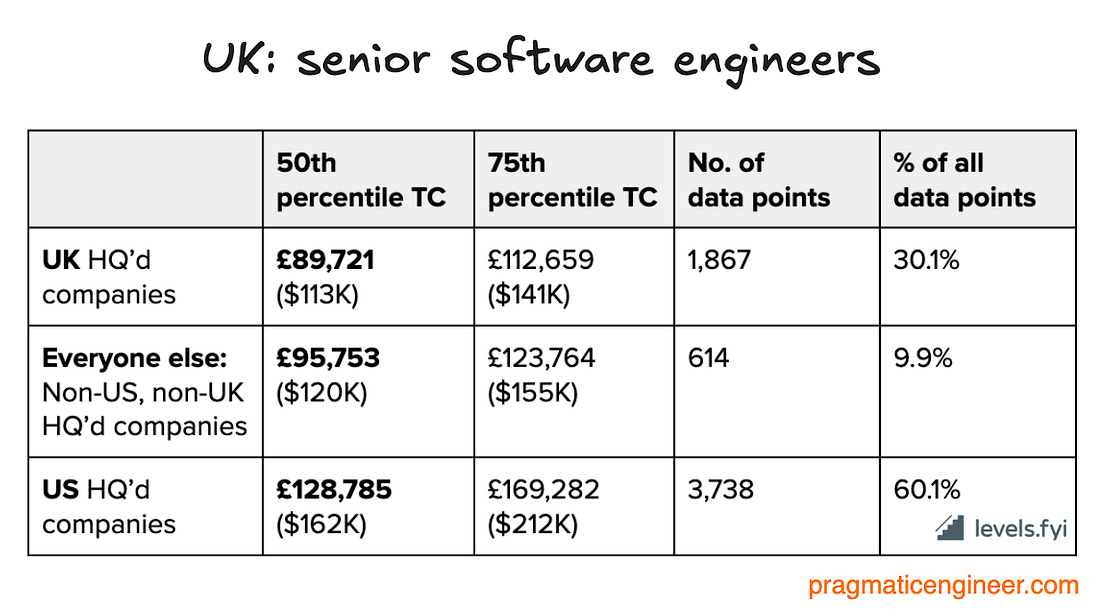
For this country, we attempt to segment data points by company-headquarter location:
Here’s data for these categories:
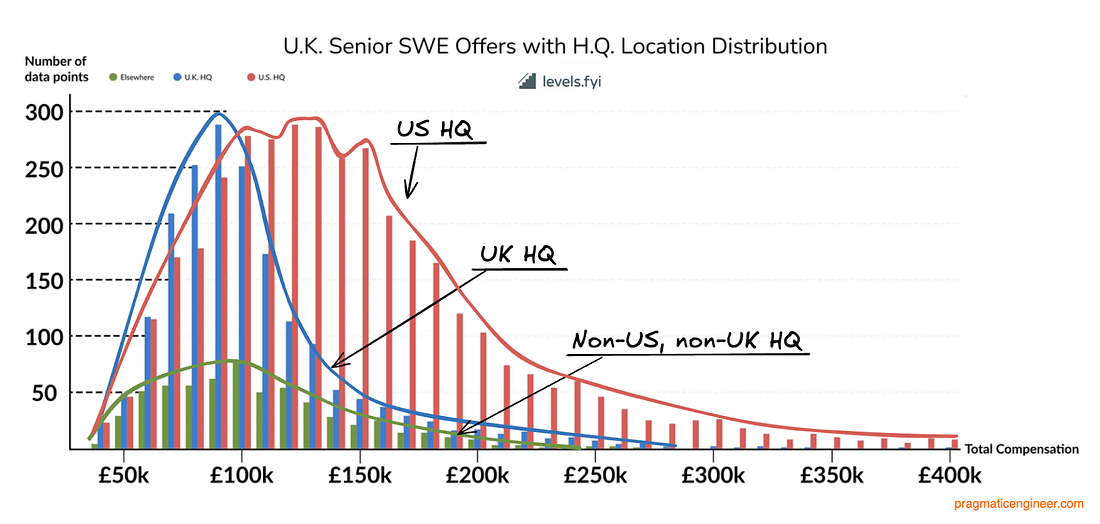
Visualizing the distribution:
A few interesting things stand out:
My sense is that for the UK, the real three tiers are those previously discussed:
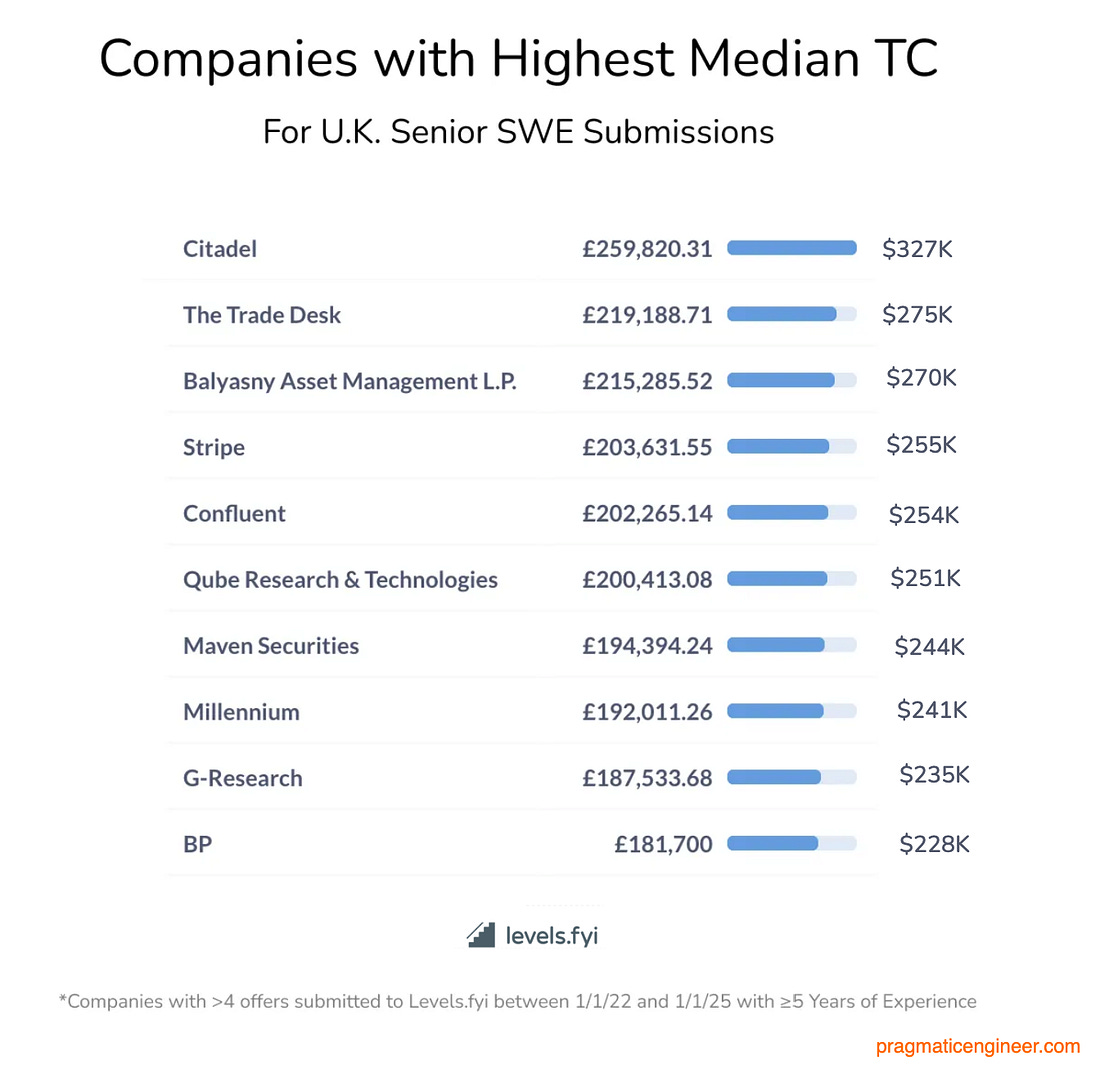
Here are companies offering the highest median total compensation in the UK:
Businesses paying the most, based on median data: Citadel, The Trade Desk, Balyasny Asset Management, Stripe, Confluent, Qube Research, Maven Securities, Millennium, G-Research, and BP – an oil and gas company, which is the only non-tech, non-finance company in the top 10. And here are companies outside the top 10, but in in the top 30:
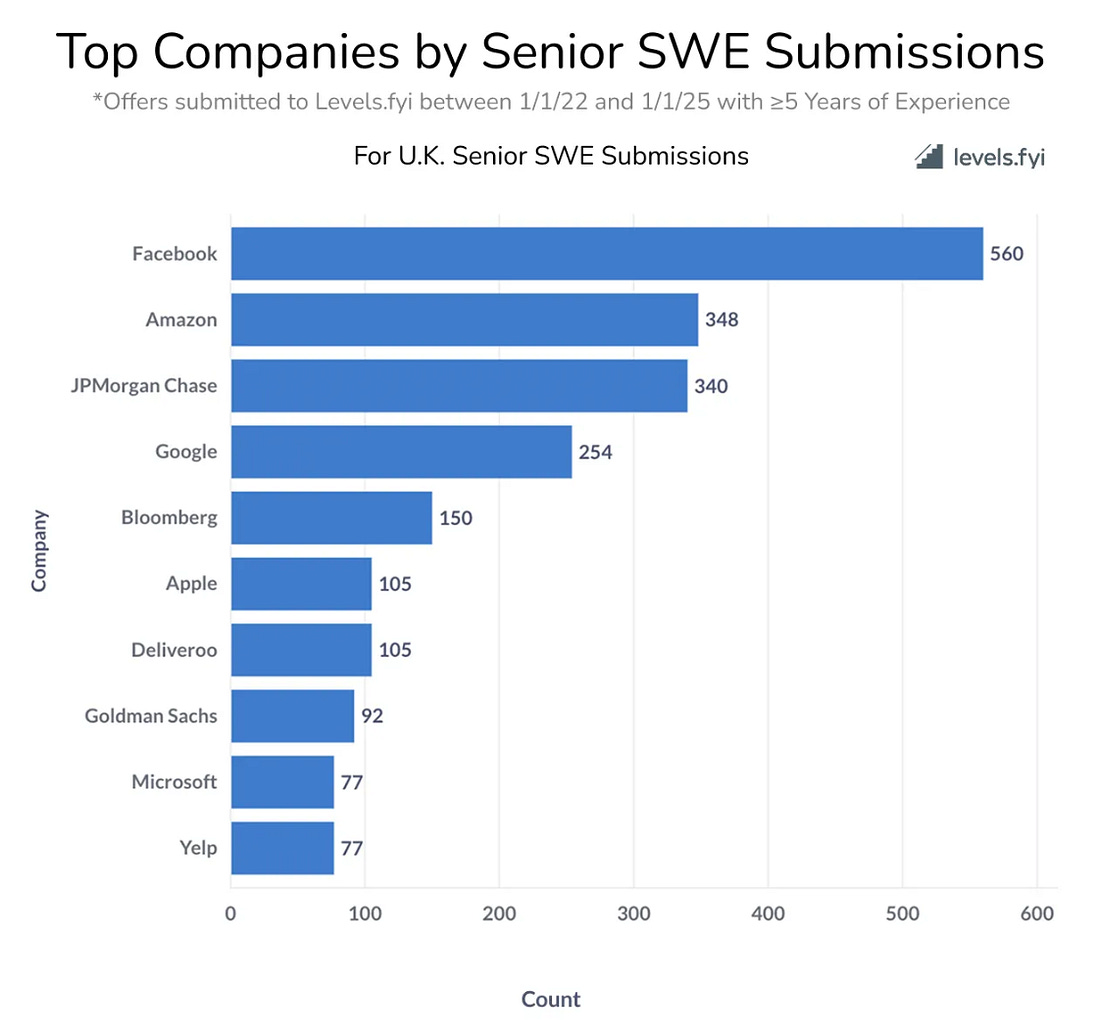
In this list, a surprise for me was to see the BBC being so competitive in compensation, compared to Big Tech companies. In all fairness, I’ve heard good things about both the engineering talent and the engineering culture at the British broadcaster. And these are the companies in the UK for which the most data points were submitted by users:
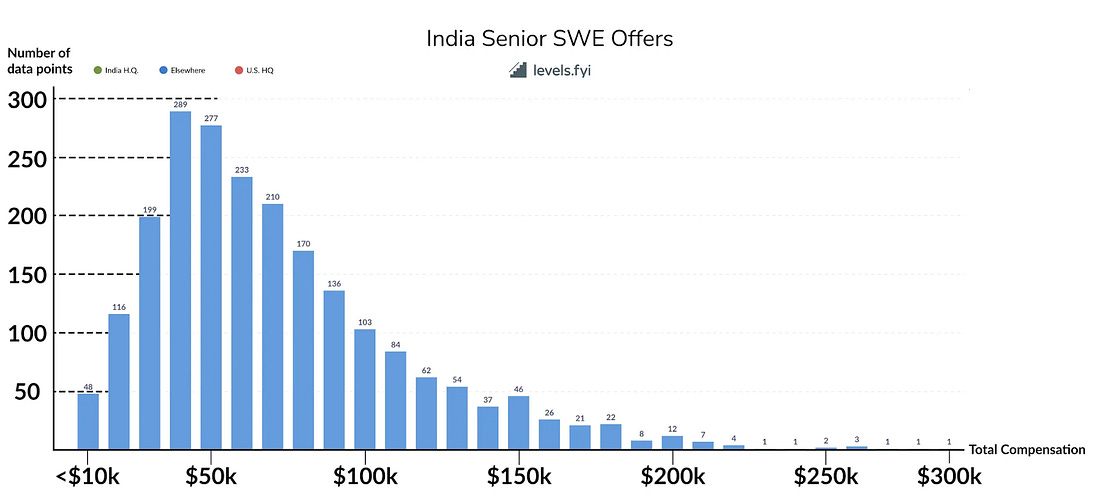
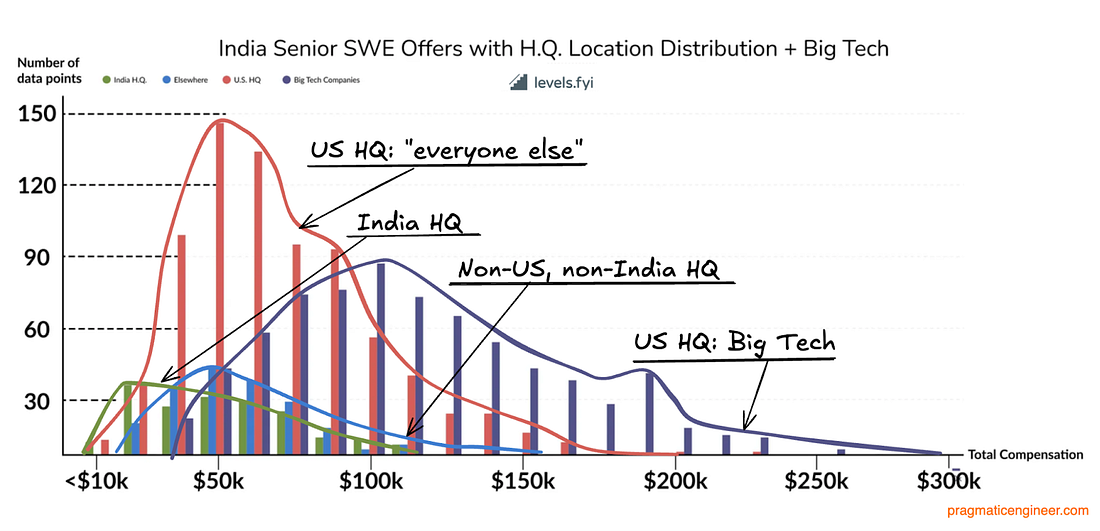
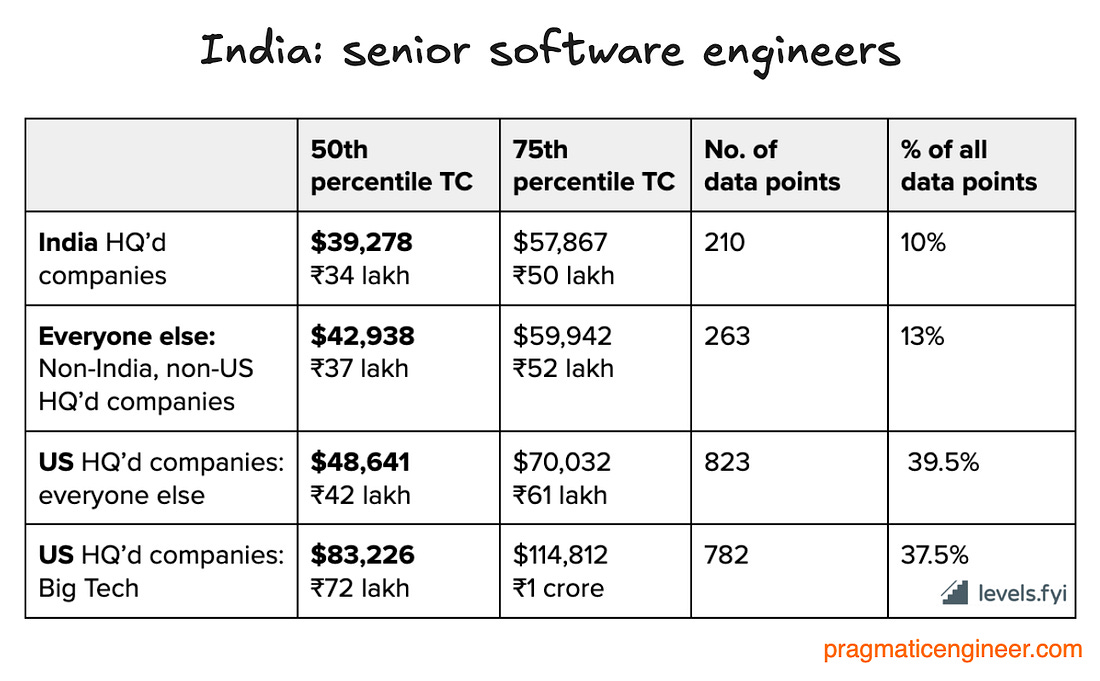
5. India numbers and tiersFor India, compensation packages are represented in USD ($100K in USD equals to about ₹87 lakhs). The split:
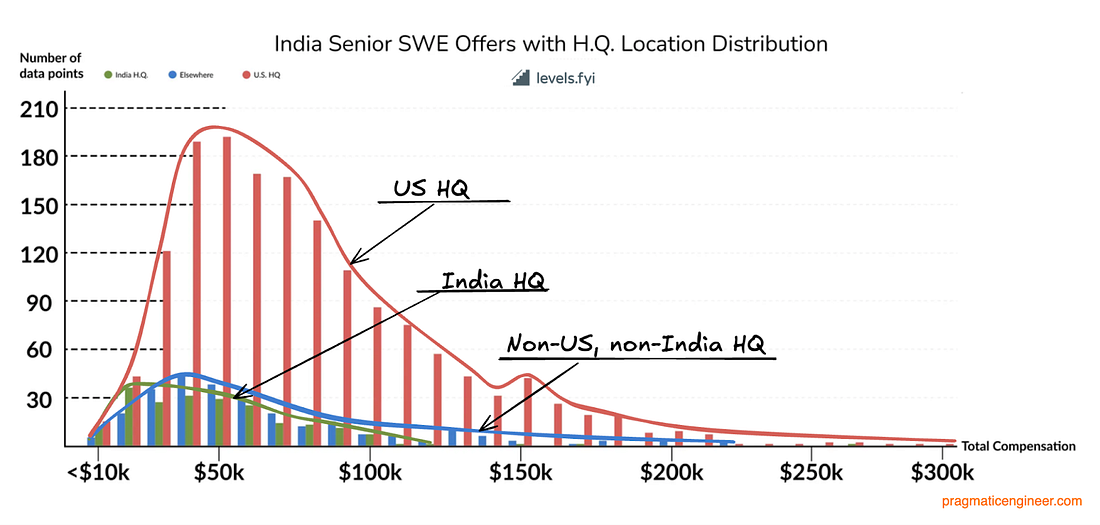
This split mirrors a single distribution, but let’s break it up by the location of headquarters:
The distribution:
It feels like US HQ’d companies might be two tiers combined, so let’s split this out by separating US-based Big Tech, and US-based “everyone else”:
There are many interesting details in this graph:
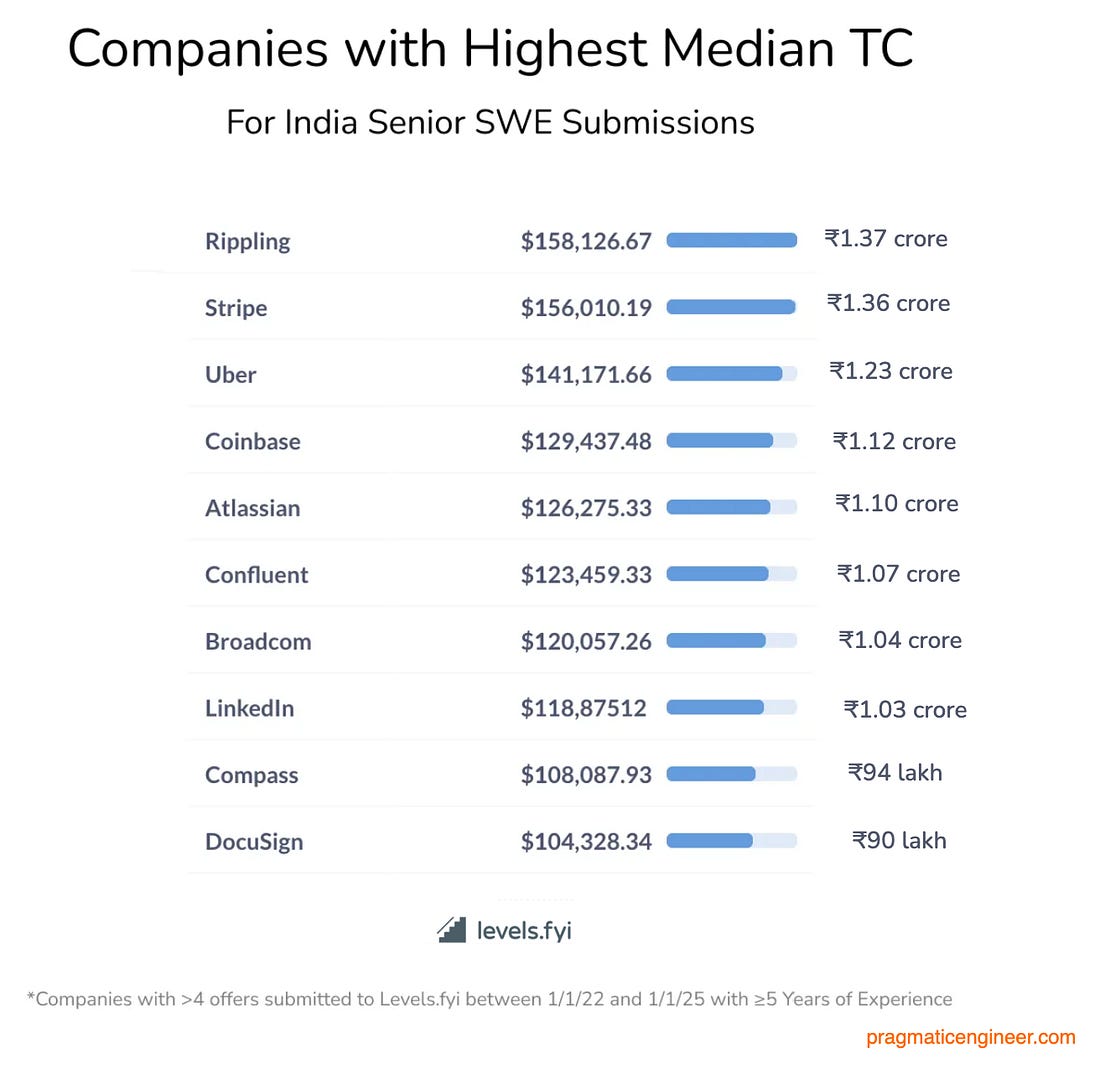
Companies that pay the most in India, as per the data:
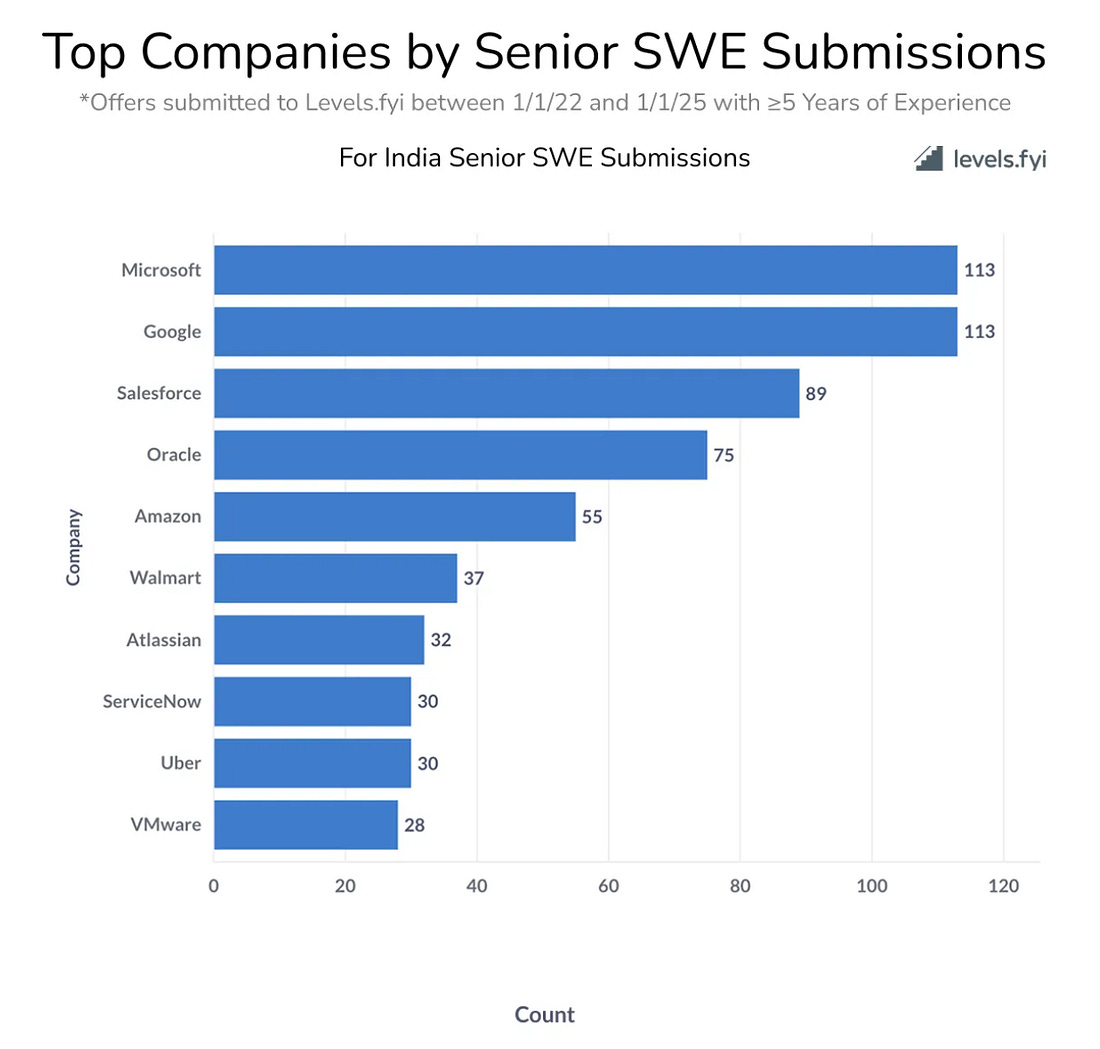
One surprise is Google not making the top 10; it comes in at number 14 overall, with median senior engineer compensation at $98K (₹85 lakh) – not far away from the top 10. One thing to keep in mind is that Google has the most data points of companies, meaning it might be more accurate. Businesses with the most data points submitted in India:
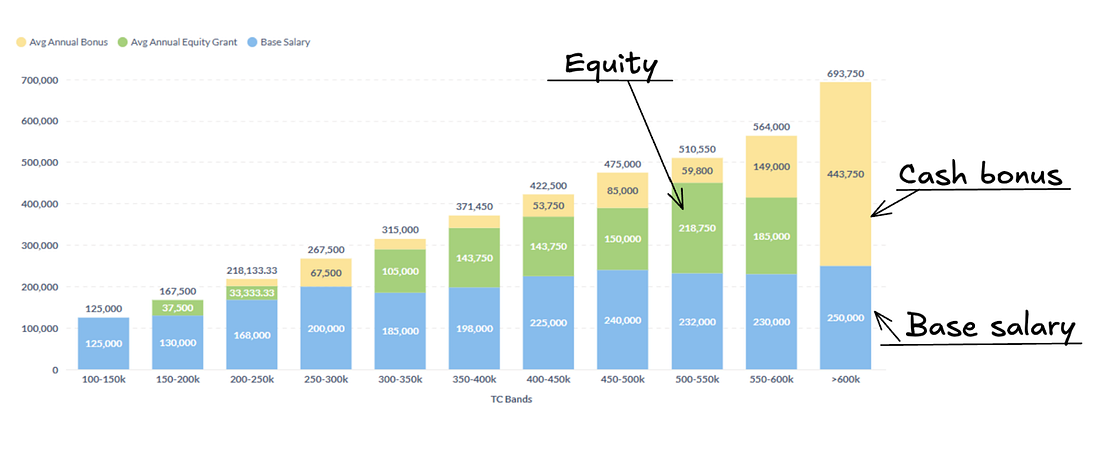
6. Note on equityThe bigger a Big Tech or VC-funded startup comp package is, the larger the share of equity. For example, here’s a visualization of the comp split for senior software engineers in the US, over the past year:
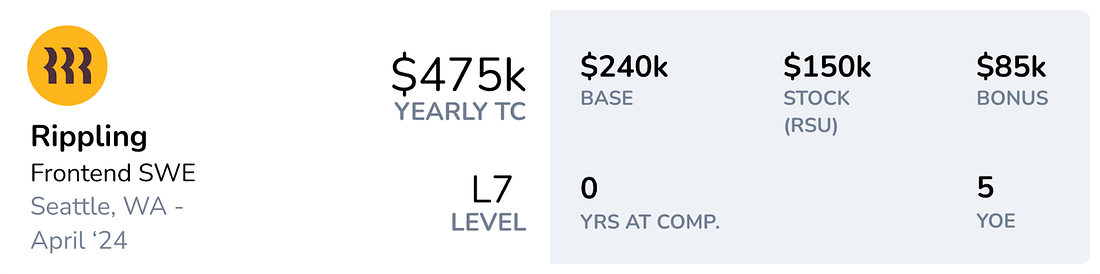
You might wonder how the largest packages have no equity component and a very large cash bonus. It’s because these are hedge funds which don’t issue equity and award cash bonuses of nearly 2x the annual salary. Non-liquid equity comes with additional risk. Let’s take two compensation packages: one with a TC of $475K, and one with $423K. Which is better? It seems like $475K is clearly bigger, but some extra context is needed. The $240K package is from Rippling, a scaleup that is not yet publicly traded:
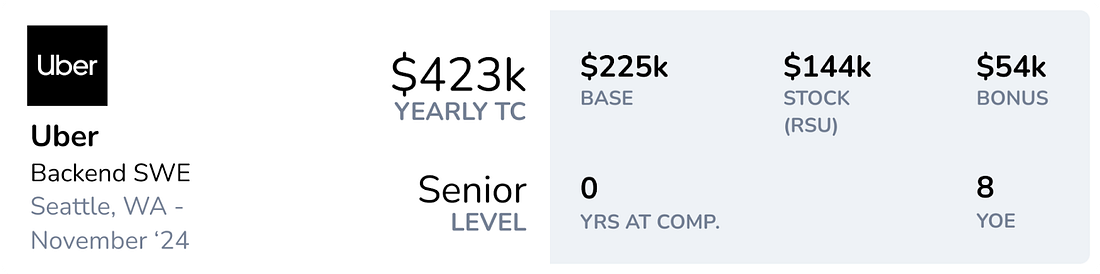
The $423K package is from Uber:
The big difference between them is that at Uber, an engineer can sell their stock as soon as it vests, (usually, quarterly) if they wish. By doing so, they earn $423K worth of liquid compensation in the first year. At Rippling, the liquid compensation will be $335K ($240K in base salary and $85K bonus target), and equity can only be sold if and when a liquidity event occurs, such as:
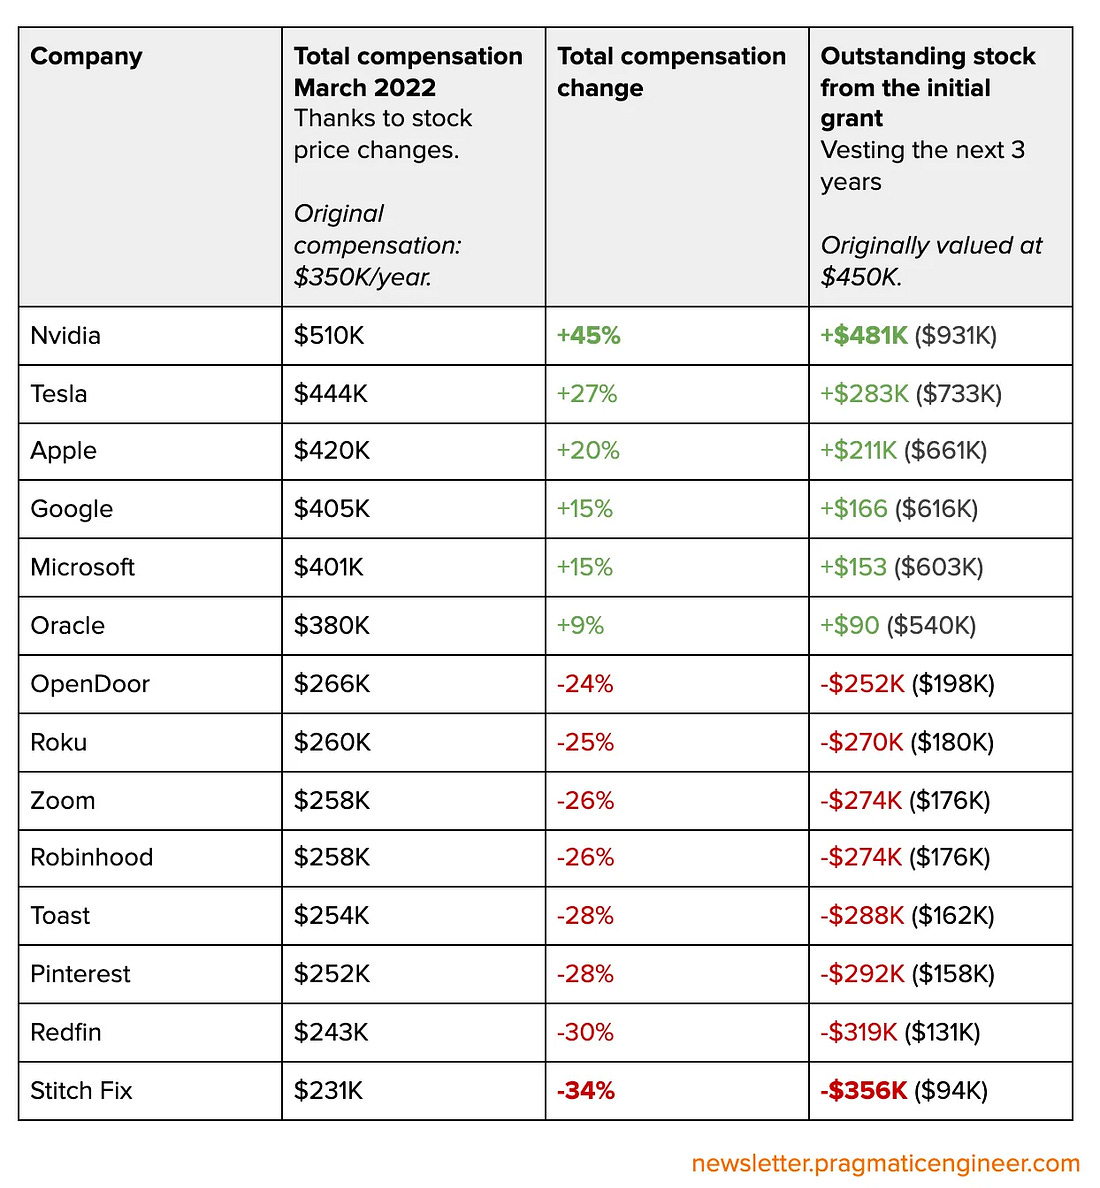
For private companies, the big questions are when will equity become liquid, and how much will it be worth. It’s worth remembering stock prices change, which makes equity compensation volatile. In 2022, we covered how this can lead to compensation woes. At the time, tech stocks like Stitch Fix, Redfin, and Zoom, dropped 50-80% in 12 months. At the same time, companies like NVIDIA, Tesla, and Apple, saw 50-100% stock price growth. Compensation packages for people working in the former group dropped significantly, while the latter group saw major increases. A $350K TC package became worth $510K at NVIDIA, and $231K at Stitch Fix:
TakeawaysThanks very much to the Levels.fyi team for sharing so much data for the US, UK, and India. It’s enabled us to visualize compensation distribution and tiers across international labor markets. Levels.fyi gives free access to its compensation data points, and relies on users sharing their comp numbers. If you’ve gotten value out of this article, please consider submitting the comp details of your current position; this lets the site provide fresh, data-backed insights, like in this deepdive. My biggest takeaways: The US is unique in having a tier above Big Tech. Across the UK, India, and in the Netherlands, the highest compensation tier (Tier 3) is Big Tech. So it’s a surprise to learn there’s an even higher tier that exists only in the US. Hedge funds, quant firms, and top scaleups can pay more than the likes of Google, Meta, Amazon, Netflix, Apple, etc, with two important caveats:
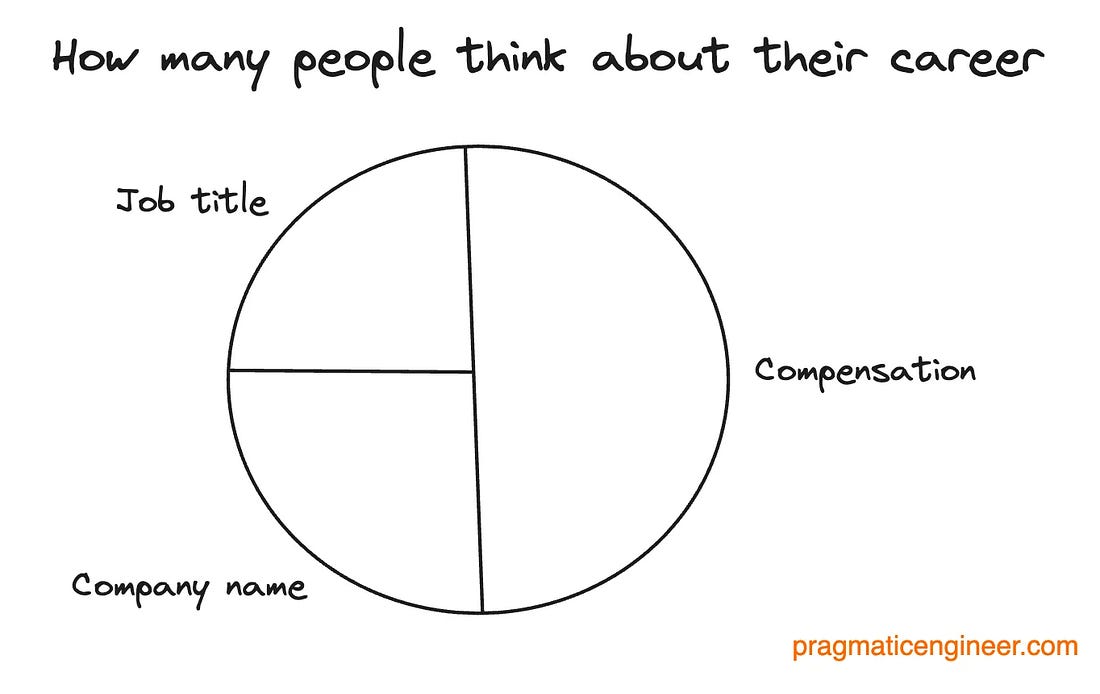
US-HQ’d companies tend to pull up markets outside the US. Among tier 3 companies in the Netherlands, 95% of those which I know are US-headquartered, and the data shows this is also the case in the UK and India. Higher-tier companies come with downsides. These workplaces pay more, but usually operate with a “Silicon Valley-style” engineering culture: they expect a lot more in terms of autonomy, taking on product, DevOps, and testing work, and working longer hours – especially when collaborating with overseas teams. Adjusting to this can be tough if you’ve never worked in such an environment. Vice-versa, it can also be challenging to swap this pattern for a more traditional, hierarchical workplace. Meanwhile, work stress can actually be higher at Tier 2 and Tier 3 companies, as covered in part 2 of the Trimodal series. Today’s job market is a lot tougher than previously, and it’s harder to get into top-tier companies. In this deepdive, we’ve looked closely at the top tiers across several markets. With the job market tightening up, there are more qualified candidates than ever, and this can affect the size of offers. So, if you’re in the job market, I would not treat the numbers in this article as concrete and immovable. Instead, just focus on performing well in interviews, and getting an offer. Then these figures might be helpful in the negotiation phase. Compensation is not everything; it’s just what is easiest to measure and make comparisons with, but there’s more to a job than the pay alone. Here’s what I used to think matters:
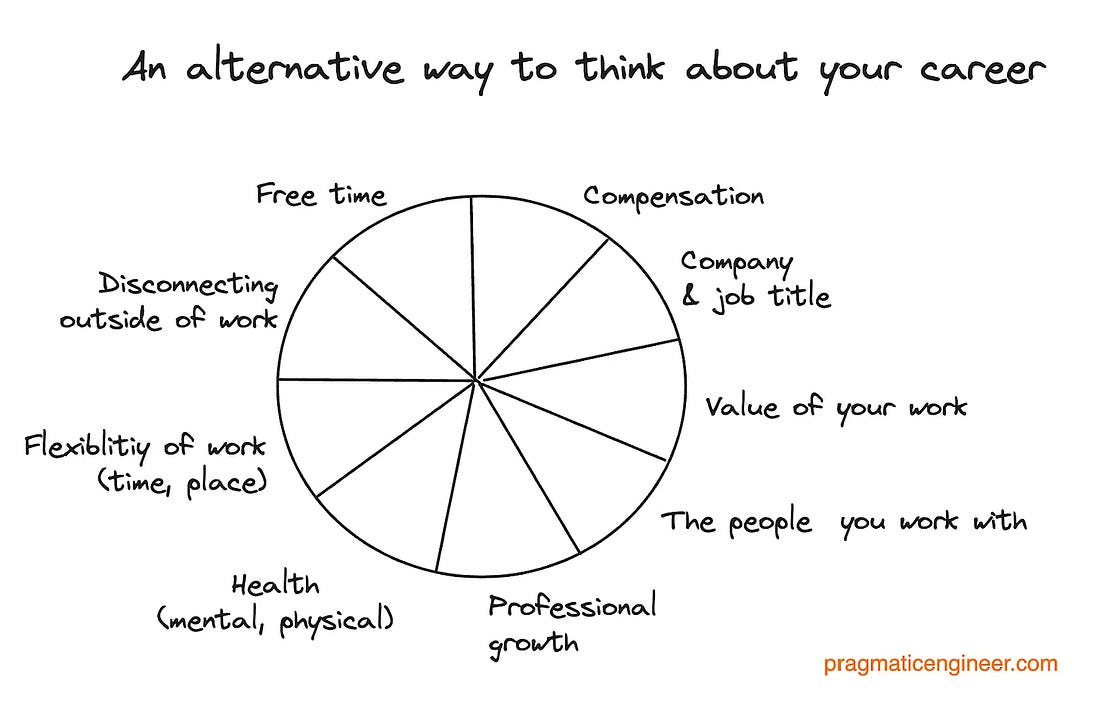
But is this all there is? I no longer think so. Other factors also make a job into a dream or a daily struggle:
If you’ve gotten value out of this data-based article, why not contribute to the wealth of knowledge about global tech compensation by anonymously sharing your current compensation with Levels.fyi. I hope you’ve found the additional data points useful, especially the expanded details on the US, UK, and India. For more on tech comp, check out other deepdives:
You’re on the free list for The Pragmatic Engineer. For the full experience, become a paying subscriber. Many readers expense this newsletter within their company’s training/learning/development budget. This post is public, so feel free to share and forward it. If you enjoyed this post, you might enjoy my book, The Software Engineer's Guidebook. Here is what Tanya Reilly, senior principal engineer and author of The Staff Engineer's Path said about it:
|


Comments
Post a Comment